Alerts and Notifications in Yugabyte Platform
November 18, 2021
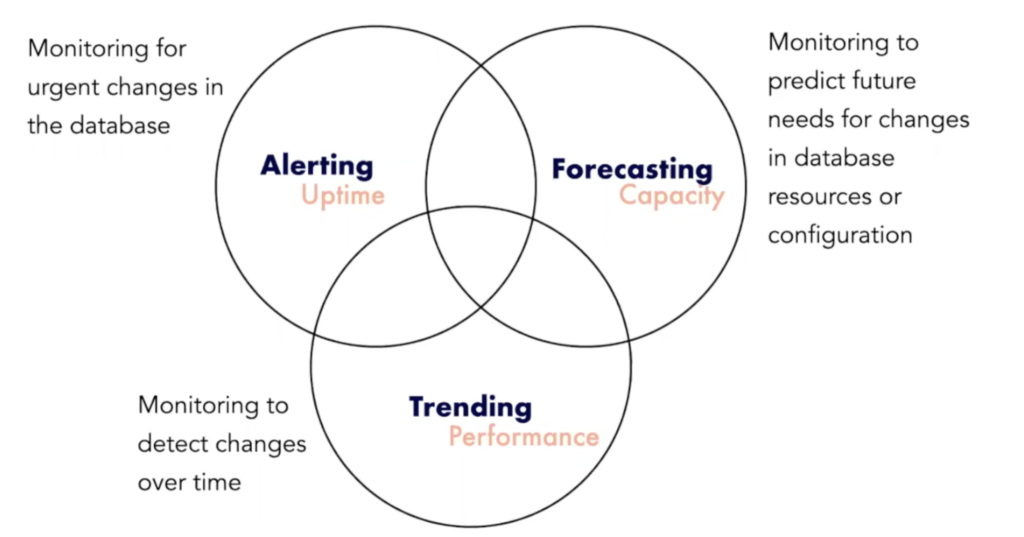
Operational visibility is key to understanding distributed SQL databases across dimensions of uptime, performance, and capacity planning. Keeping tabs on uptime is crucial for running clusters in production. You need to ensure you have the right process and alerting system in place to allow for fast action, as illustrated in the below diagram.
Yugabyte Platform offers a dedicated observability and monitoring view, which serves as a single pane of glass for the customer’s performance metrics across all clouds. It also comes with various default alerts and built-in features to protect against failure, such as health checks and a metrics dashboard.
In addition to the above features, it is critical to actively monitor the overall health and performance of clusters running in production by creating alerting rules that promptly send notifications when there are events that require either investigation.
We also understand that every customer is unique, so we offer our customers the choice of how they want to use those pre-defined rules. They can be tuned to customer-specific use cases and requirements.
With the release of YugabyteDB 2.8, we outsourced the tedious task of watching observability screens to intelligent, reliable automated assistants. These assistants can transform all anomalies into notifications when something abnormal happens to the database deployments. This new feature helps our customers organize and curate all events into categories. It also removes repetitive notifications and allows focus on the important notifications for each functional team.
To get notified in real time about database alerts, users can set alert policies based on their universe metrics. Alert policies notify you when a performance metric rises above or falls below a threshold you set.
While building our Alerts and Notifications feature, we involved our Support/SRE teams to leverage their years of experience supporting YugabyteDB deployments. They produced fine-tuned, YugabyteDB-tailored recommendations in the form of predefined alerting rules that are ready to use out of the box. In this blog post, we’ll walk through how this new feature works and give you a taste of what to expect in future releases.
Alert definition and types
Yugabyte Platform has default, preconfigured alerts, both at the Yugabyte platform and universe level. Universe alerts can be configured globally for all universes, or per specific universe. In addition to the above default alerts, users can configure their alerts based on a specific condition on any available metric.
Readily available alerting templates
This new feature comes with 30 predefined alerting templates. They are configured by our support experts and cover most of the standard scenarios. Predefined alert templates include TServer unavailable, CPU/disk/memory utilization, max connections, clock skew, health check, and network errors.
Highly configurable alert rules
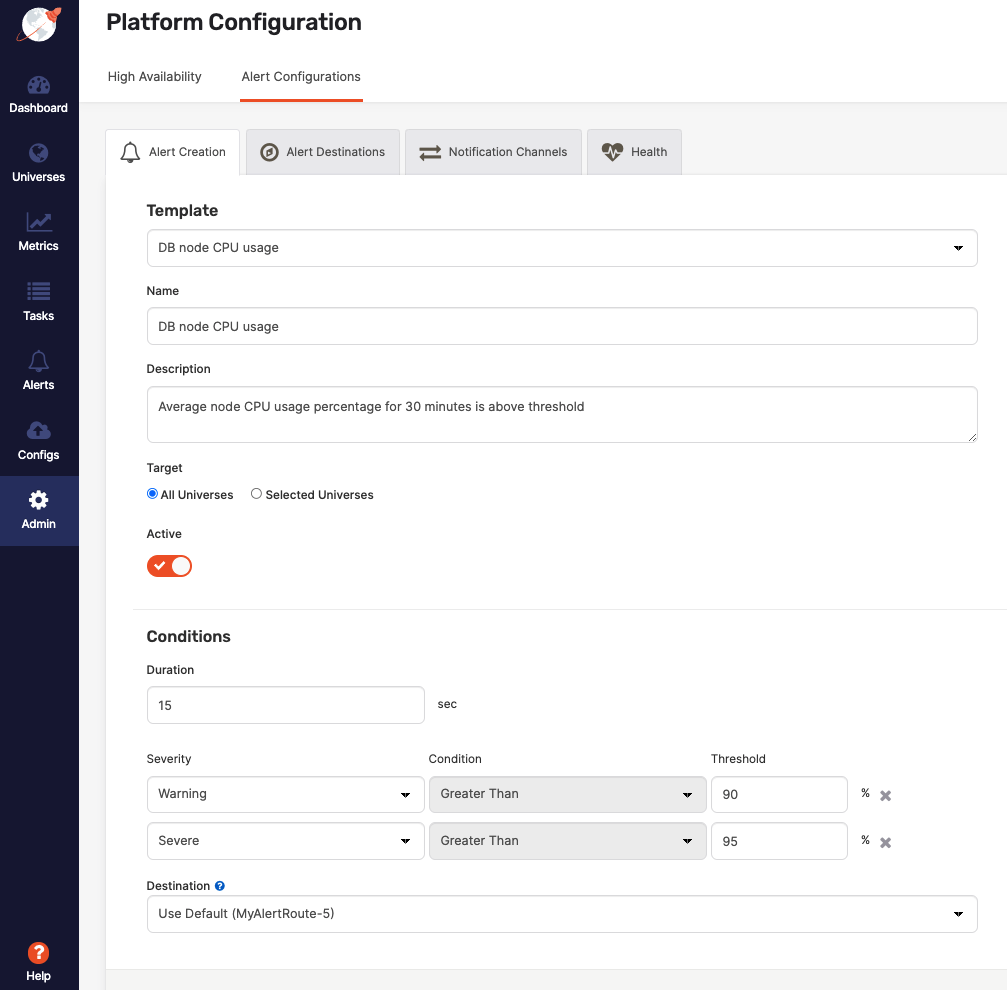
Customers can change the canned alerting templates to produce custom rules that perfectly fit their specific needs or they can start from scratch and create their own.
Alert templates come with a user interface for the management of all rules. Customers can change the parameters of the existing rules or create new rules from scratch. Andor every alert, you can configure the following attributes:
- Alert name and description
- Metric name
- Target (platform vs specific universe vs all universes)
- Metric threshold value
- Operator (less than, equal to or greater than)
- Duration
- Severity (warning and severe)
- Destination (email, slack, etc.)
View alert history
Once you are logged into Platform Console, “Alerts” can be found on the left side menu. By default, alerts are sorted in reverse chronological order by the alert raised time, but you should have the ability to reorder the list by clicking the column headings. This shows the log of all alerts that have been fired but are no longer firing. They can be filtered by various fields like status severity and sorted by date, name, and status.
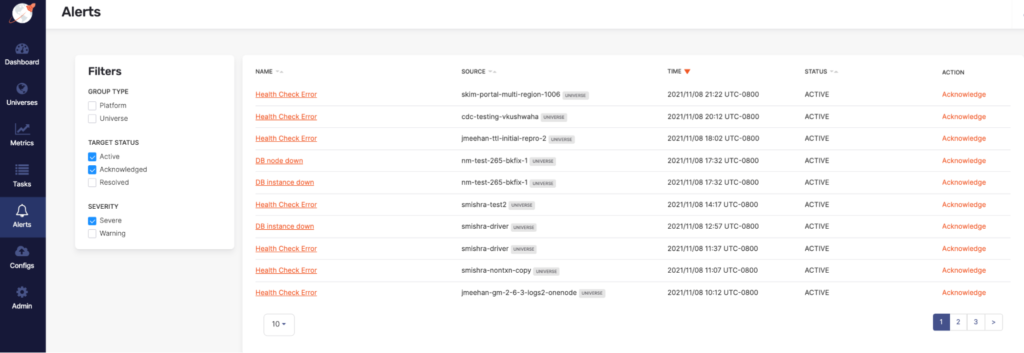
Triggered state indicates when on the most recent alert check the configure threshold was breached. For example, if your alert rule checks whether average CPU utilization is above 75% for 10 minutes, your alert should be triggered as long as the CPU is above 75%. You can Acknowledge alerts to avoid repetitive alerts. When you acknowledge the alert, Yugabyte Platform sends no further notifications to the alert’s configured destination or until you resolve the alert. The distribution list will not receive any notification of the acknowledgment. Alerts get resolved when the alert condition no longer applies.
Get notified your way using Alert Destinations
Whenever an alert triggers, it sends an alert data to its designated alert destinations. Alert destinations consist of one or more channels. Whenever an alert is triggered, it sends the related data to its designated destination. A notification channel defines the means by which an alert is sent (e.g. Email or Slack) as well as who should receive the notification.
Alert destinations help extend your alerts by connecting them to actions that use built-in integrations for Email and Slack channels, with PagerDuty and Webhooks coming in upcoming releases. The notifications include relevant information in your alerts with easy to configure templates that give context and details for taking action.
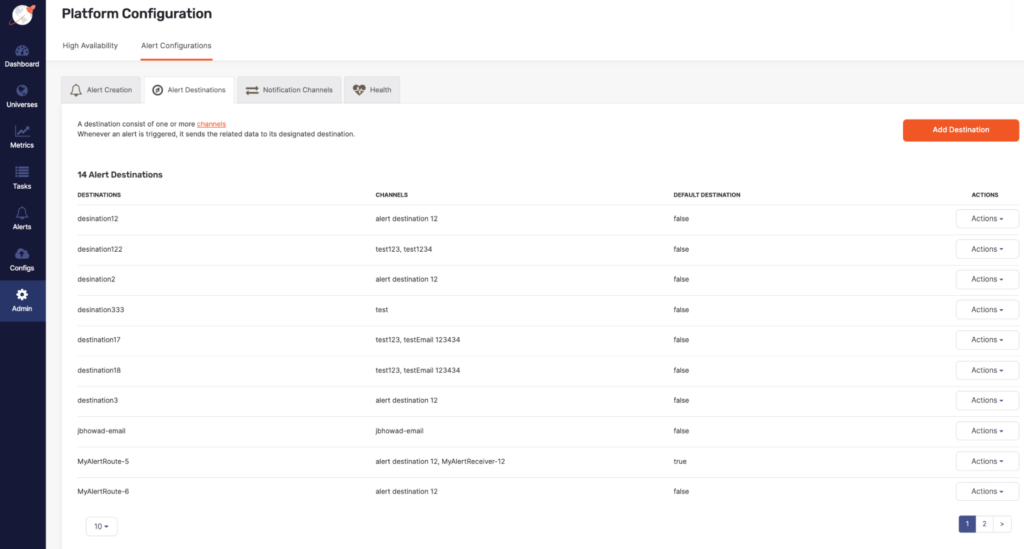
You can include multiple notification channels in an alert destination. Notifications are used to define who will be notified and on what conditions. For example, you can configure an alerting destination to email support-team@example.com and to post a Slack message to the channel #support-team.
Configuring Slack as an alert destination
- Send the alert to a Slack channel in the authorized Slack workplace for the Organization.
- Enter the channel name and either an API token or a Bot token.
- To create an API token, see the API page in your Slack account.
Monitor all of your alerts in one place using Federation
Federation allows a Prometheus server to scrape selected time series from another Prometheus server. It is commonly used to either achieve scalable Prometheus monitoring setups or to pull related metrics from one service’s Prometheus into another. All Yugabyte Platform aggregated metrics can be scraped into a different Prometheus system using built-in federation.
Prometheus endpoint
Every node of a Yugabyte universe exports granular time series metrics. The metrics are formatted in both Prometheus exposition format or JSON for seamless integration with Prometheus, a popular standard for time-series monitoring of cloud native infrastructure that treats time-series data as a data source for generating alerts. The format is easy-to-parse and can be massaged to work with other third-party monitoring systems like Grafana.
These time series metrics are available in following two formats:
1. Prometheus format:
- Users can view Tserver metrics in Prometheus format in the browser or via the CLI using
curl <node IP>:9000/prometheus-metrics - Users can view Master server metrics in Prometheus format in the browser or via the CLI using
curl <node IP>:7000/prometheus-metrics
2. JSON Format:
- Yugabyte Platform provides an API that can expose the health check results as a JSON blob. You can view Tserver metrics in JSON format in the browser or via the CLI using
curl <node IP>:9000/metrics - Using this API to retrieve health check alerts would require the users to first parse the JSON, and then do some text parsing afterward to scrape the metrics from each field.
Scrape metrics from Yugabyte Platform
To federate metrics from Yugabyte Platform, configure your destination Prometheus server to scrape from the /federate endpoint of a Yugabyte Platform(source server), while also enabling the honor_labels scrape option (to not overwrite any labels exposed by the source server) and passing in the desired match[] parameters.
For example, to scrape all metrics from Yugabyte Platform, the following scrape_configs federates any series with the label job=”yugabyte or platform or node” or a metric name starting with yugabyte/node/platform from the Platform Prometheus servers into the scraping Prometheus:
# federate endpoint configuration
  - job_name: 'federate'
    scrape_interval: 15s
    # honor the labels from Platform's prometheus server if there's a label conflict
    honor_labels: true
    metrics_path: '/federate'
    params:
        # grab all node_exporter and platform metrics from two Yugabyte Platform nodes
        'match[]':
        - '{job="node"}'
        - '{job="platform"}'
        - '{job="yugabyte"}'
        # Use this match to grab ALL jobs instead of the ones above
        # - '{job=".+"}'
    static_configs:
      - targets:
        - 'xxx-yugaware.gcp:9090'
        - 'xxx-yugaware2.gcp:9090'
Once this is configured, it would be possible to make API calls against this separate Prometheus server that would return metrics for both of the Yugabyte Platform nodes in the configuration.
Configurable alerting rules
Alerting Rules can be configured to trigger alerts in Prometheus. Alerting rules allow you to define alert conditions based on Prometheus expression language expressions and to send notifications about firing alerts to an external service.
An example rules file with a configurable disk usage alert would be:
groups:
- name: node
  rules:
   - alert: DiskUsageCritical
    expr: (node_filesystem_avail * 100) / ignoring(saved_name) node_filesystem_size {mountpoint = "/"} <= 20
      and ON (instance, device, mountpoint) node_filesystem_readonly == 0
    for: 5m
    labels:
      severity: Critical
    annotations:
      summary: Disk has exceeded 80% full threshold
      description: 'Disk has exceeded 80% full threshold. Remaining free space: {{ $value }}%'
      message: 'Free space: {{ $value }}%'
What’s coming next in Alerts and Notifications
At Yugabyte, we strive to be fully transparent with our customers and user community. This blog covered an overview of the foundation we built in the first phase. Here are some notable features you can expect in the second phase as part of upcoming releases:
- Maintenance window: Yugabyte Platform will have the ability to temporarily suspend alerts by creating an alert maintenance window. For example, you can create a maintenance window that suspends host alerts while you shut down hosts for maintenance.
- Control access to alerts with flexible permissions: Role based access control (RBAC) can decide who can view, create and admin alerts, channels, and destinations.
- Notification frequency: Yugabyte Platform will send notifications to your chosen alert destinations whenever it detects that the alert status has changed, as follows:
- Just once: Send a notification when the alert is raised.
- Each time an alert is evaluated: Sends a notification whenever the alert status is triggered regardless of its status at the previous evaluation.
- At most every: Sends a notification whenever the alert status is triggered at a specific interval.
- Additional Alerts and support for third-party channels, including PagerDuty and Webhooks.
Get started
We’re very happy to release the first phase of Alerts and Notifications as part of YugabyteDB 2.8. Beyond the introduction provided in this post, we also invite you to learn more and try it out by:
- Installing YugabyteDB 2.8 in just a few minutes
- Joining us in Slack for interactions with the broader YugabyteDB community and real-time discussions with our engineering teams


