Recapping My Internship at Yugabyte – Jayden Navarro
October 1, 2019
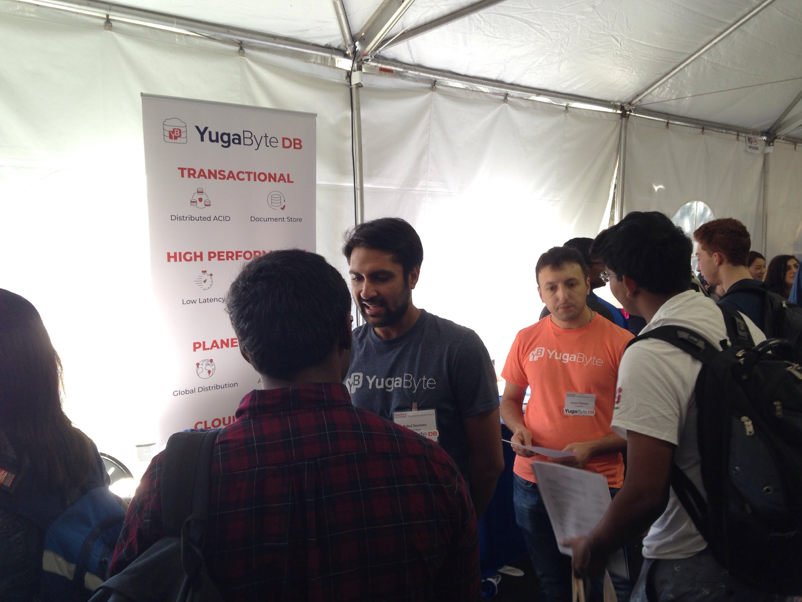
It was a warm day in early October, and two large white tents occupied the lawn that sits between the Gates, Hewlett, and Packard buildings. Companies pasted the word “AI” in big bold letters across their banners, and students formed long lines, resumes in-hand, eager to learn about the Next Big Thing and how often the company cafeteria serves Poké.
Six months prior I had made the decision to leave my comfortable job as a Software Engineer in the networking industry and pursue a Masters degree in Computer Science at Stanford, and I was going to take full advantage of the recruiting opportunities that the program offered. Intense coursework had pushed me to my mental limit, exams couldn’t be finished in the allotted three hours, I had relinquished stock grants and strained personal relationships; it had to be worth it in the end. I left networking to study an area I was passionate about, distributed storage, and I wasn’t going to settle for anything less than an internship on a distributed storage team.
I targeted the big companies I knew had these teams: Google, Microsoft, Amazon, and Dropbox. Putting on my name tag and entering the tent, I was hopeful for the opportunities to come. “Here at Company X the internship teams are based on project proposals and matching previous experience” and “we cannot guarantee you’ll be put on your top listed teams” were phrases often echoed. I was wary of being placed based on what I had done in the past, not what I wanted to do in the future. I left the tents less optimistic than when I had entered, would it even be possible to get an internship in the area I wanted?
During my next lecture I snuck out my phone and went to the career fair app, checking if there was anything I had missed. Scrolling down the page I passed by tech giants, fintech behemoths, and unicorn startups, and nestled at the bottom of the alphabetically sorted list was a company I had never heard of: YugabyteDB. A database company, I thought, maybe they’ll have a team I’d want to work on. Bringing up the site I was greeted with the slogan: High-Performance Distributed SQL. I went to their docs page and saw architectural diagrams of a 2PC distributed transaction path, references to Raft and Hybrid Time, and details about the core distributed key value store that powered the product. I had to go chat with these guys.
I went back to the career fair with a newfound purpose. Looking around the room I saw the orange and purple YugabyteDB booth which stood out boldly against the white tent. I approached the table and struck up a conversation with Bogdan, a founding engineer of the company, who gave a high-level overview of the product and the kinds of projects I could expect to work on during my internship. We talked about my background and found a common thread in some of my public cloud experience, Bogdan himself having helped engineer the high-availability networking component of their cloud integrations. Despite some of my previous experience fitting in on the orchestration side of the product, it was clear to me through our conversation that if I interned at the company I would be able to work in the area I was passionate about: the core distributed database.
Driving back home I called my wife, “I think I’ve found a company I really want to work for. It has an unusual name: Yugabyte.”
Interviewing
After applying for an internship at the career fair I was soon contacted to set up a time for a phone interview. The phone interview took roughly 45 minutes and covered standard algorithms and data structures topics with interactive coding through an online text editor. I was invited back for an on-site the next week where I met with several engineers and was interviewed by Kannan, the CEO of Yugabyte. Talking with Kannan I was impressed by the motivation and vision he had for the product, namely to eliminate the operational overhead of manually sharded SQL and to provide customers a database with the transactional guarantees and features of traditional SQL with the scale of NoSQL.
The day after the interview they reached out to let me know they were going to extend an internship offer. The entire process took less than two weeks and the team was extremely communicative and quick to respond to any questions I had.
First day and first project
Final reports were submitted and exams graded; my first day at Yugabyte was here. When I arrived at the office I was greeted by the friendly office manager Susan, and shown to my desk where my laptop and badge awaited. After an expedient HR onboarding, I was pointed to the engineering docs which had a helpful getting started guide. The guide pointed to various services and sites I would need to register on, and included instructions for setting up the rest of the tooling required to develop and build the codebase.
Once settled in I was approached by Bogdan, the engineer I had chatted with at the career fair, who I now learned would serve as my mentor for the internship. He dove into the architectural details of YugabyteDB, from the tablet bootstrapping process to recover from node failovers to the use of bloom filters in RocksDB to avoid unnecessary SSTable scans.
I was then given my initial starter project, to add to the UI a unified view of all in-progress asynchronous tasks initiated by a master node. A simple change, but one still requiring consideration of concurrency issues, such as determining which data structures were accessed by the parallel task threads, and guarding reads of these structures with the corresponding read lock.
In addition to getting up to speed on the development workflow, this first project demonstrated the power of Yugabyte’s testing framework. During the code review phase projects are run against the set of tests that could be impacted by the given change. The tests are run against binaries from multiple compilers and build targets/systems including release and debug builds for: CentOS GCC, CentOS Clang, and MacOS Clang. Additionally, the tests are run on two special targets: CentOS Clang AddressSanitizer (ASAN) and CentOS Clang ThreadSanitizer (TSAN). The former runs the tests under an address sanitizer which checks for memory leaks/errors, and the latter instruments memory accesses to detect potential data races. All test results are aggregated in an internally developed tool called Detective which identifies test failures that are likely caused by your change based on the failures reported against baseline builds of the master branch.
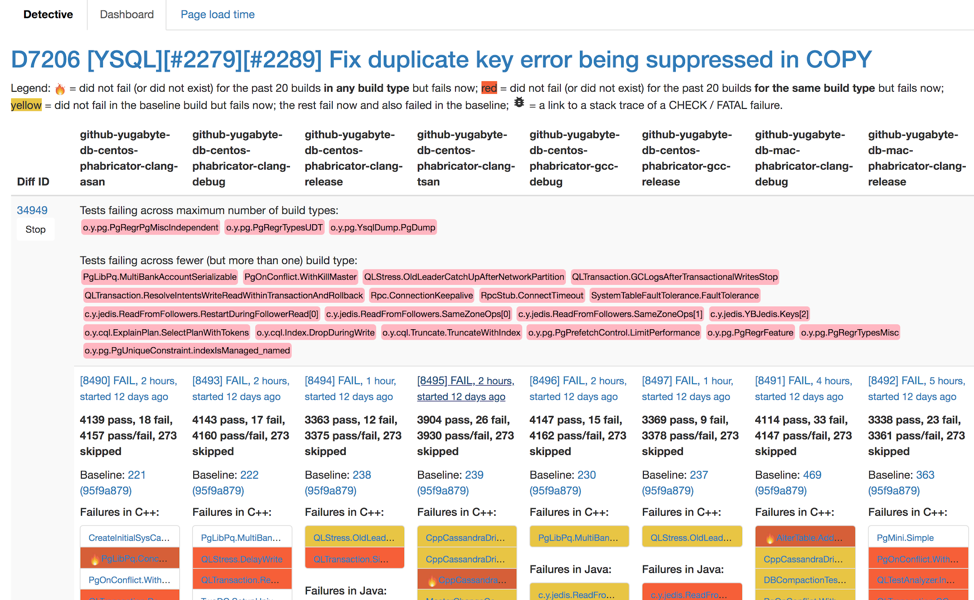
Screenshot of Detective from another project I worked on
When checking Detective for my project, I noticed a large group of tests were failing under the ASAN and TSAN builds, but passing in all other build types. After reading through the test logs and reproducing the test failures in my local environment I was able to root cause the problems. The ASAN failures were caused by a raw pointer that was detached from a smart pointer and became dangling after the capturing variable went out of scope, which was resolved by changing all paths that used the raw pointer to use smart pointers. The TSAN failures were caused by a new flag that was being set in a unit test while being read from a background thread of the master process, which was resolved by changing to atomic setters/getters. Both obvious oversights and something that would have likely been caught in code review, but it was still important to have these cases covered by the testing system.
After a few rounds of review comments and addressing the feedback, the code was landed. With the initial task completed, I was ready for my first large project.
Performance
YSQL performance was the overarching theme of the large projects I worked on at Yugabyte. YSQL is the PostgreSQL-compatible Yugabyte SQL API. With the goal of becoming the de facto distributed SQL database, the approach to YSQL development had been to focus on correctness and SQL/Postgres feature support. This is not to say that performance was a secondary priority, in fact YSQL has done quite well against competitors, however for some features there was still significant room for improvement.
The first of these projects was adding support for bulk inserts to the COPY command which resulted in a 30x speedup of COPY. The second project added a non-transactional fast path for single-row UPDATE/DELETE statements which led to a 2.5x speedup of affected queries. The third and final project was to add support for aggregate pushdowns to the distributed storage layer (DocDB), which lead to a 99% reduction in inter-node RPCs for aggregate queries.
Bulk COPY
COPY is a Postgres command that allows for easy loading of data in and out of a database, either through files or STDIN/STDOUT. The motivation for adding bulk inserts to COPY was simple: COPY was extremely slow in YSQL due to the use of synchronous inserts.
Adding this feature was straightforward from an architectural point of view. While DocDB, YugabyteDB’s storage engine, already supported the ability to do transactional multi-row inserts, the YSQL layer needed to be augmented to also perform bulk inserts inside of a single transaction.
The primary challenge, and the reason transactional bulk inserts had not been supported earlier, is due to the way secondary indexes are updated in YSQL. When a row is inserted in a YSQL table, the column values are sent to DocDB which computes an encoded key based on the primary key column values. This encoded key is then used in DocDB to identify the row. In order to insert into a secondary index this encoded key must be sent along with the indexed column’s value, which is then used to refer back to the base table row when the index is utilized by a future query. Previously, the only way to retrieve this encoded key was to wait for the base table insert to complete and then retrieve the value from the returned response. This meant that secondary index inserts could only occur after the synchronous base table insert.
There were two solutions to this problem. The first was to asynchronously send base table inserts, then when the response was received trigger a callback that performed the secondary index insert (also asynchronously). Due to the transactional isolation guarantees provided by DocDB this would have been equivalent to the earlier synchronous inserts. The second solution, and the one we ended up choosing, was to expose the encoding to the YSQL layer, allowing us to compute the encoded key without waiting for the response from DocDB, enabling inserts to the base table and secondary index at the same time.
After implementing the feature the gains were immediate, as the previously synchronous inserts were now sent in batches of 512 inserts, leading to a 30x speedup.
Fast path UPDATE/DELETE
Vanilla Postgres runs all queries inside of transactions, even standalone statements. This provides the guarantee that all composite parts of a single statement will commit atomically, and with the isolation properties of the selected isolation level. Running every statement inside of a transaction does not cause a significant performance impact due to the low overhead of single-node transactions. However, in a distributed SQL database like YugabyteDB, where transactions can span multiple nodes, running all queries inside of a transaction is more costly. If the multi-shard transactional IO path is used, even if the statement only affects data stored on a single node, multiple synchronous RPCs are required to setup the transaction status record, send provisional writes, and finally commit the transaction.
To avoid this overhead for inserts that only affect a single row, YSQL uses a special fast path which bypasses the more expensive multi-shard transactional IO path. Multiple checks are made to ensure YSQL provides the same transactional guarantees as Postgres, such as verifying the query is being executed outside of an explicit transaction block and that the table does not contain secondary indices or triggers, and only when all conditions are met is the fast path used. However, this feature was only used for INSERT and was not implemented for UPDATE or DELETE.
When starting on this project I thought the change would be very straightforward, simply whitelisting the fast path for UPDATE and DELETE queries. However there was a complication, the query plan used for UPDATE/DELETE first performs a scan to retrieve the existing rows affected by the query before updating/deleting the rows. This approach is required when the query could affect multiple rows, potentially spanning multiple tablets/nodes, however in order to use the fast path the query can only affect a single row, thus a single tablet/node, so all primary key values must already be specified in the query itself. This is in contrast to a simple INSERT with a VALUES clause where the query plan recognizes that all values needed to perform the insert are already present and does not require a scan.
In order to safely bypass the multi-shard transactional IO path it was necessary to remove the scan from the query plan and substitute in the primary key values as fixed constants to identify the existing row. As opposed to the previous execution-time query plan analysis to determine whether the fast path could be used for inserts, UPDATE and DELETE would require analyzing the selected query path during the planning phase, and substitute the scan with the constant values while constructing the plan. There were also a larger number of checks that needed to be performed for UPDATE/DELETE before choosing the fast path, such as whether the WHERE clause predicate included any additional columns or whether the expressions in the UPDATE referenced any non-primary key column values from the existing row.
Once the changes were made on the query layer, the feature mostly worked as expected as it used the existing fast path code. However, there was one case that was not handled properly, the case where the row didn’t previously exist. Postgres returns to the user how many rows are modified by a DML statement, so it is necessary to know whether the row existed before the update/delete was performed. This was previously not an issue, as the initial scan would return zero rows in this case so the query execution would not run the backend update/delete. However, as the scan was now bypassed, it was necessary to propagate whether the row was found back in the DocDB update/delete response and up to the query layer.
Once this change to DocDB was implemented, I noticed something peculiar: tests started failing in Detective. It turns out that there was a previously unknown semantic difference between the DocDB update and Postgres UPDATE: DocDB performed upserts! This previously hadn’t been exposed as the initial scan prevented any calls to the DocDB update for non-existing rows. By returning early when the row didn’t exist in a DocDB update it no longer was performing these upserts.
Postgres doesn’t support upserts in UPDATE, so why would disabling them in DocDB cause problems? After looking into the failures, I realized that the tests that were failing all used a particular Postgres system table, pg_shdepend, which tracks dependencies between objects and shared objects. pg_shdepend is one of the few system tables that does not contain a primary key, and in YSQL this means the table uses a randomly generated internal key to identify the row. There was a previously undiscovered bug in the system catalog update/delete code that was generating a new random key for each of these operations, meaning every update was attempting to modify a row that did not exist. Once upserts were disabled these updates were no longer inserting the values into the table that were expected to be there, causing the test to fail. The reason this bug hadn’t been caught earlier was because the pg_shdepend table is only used as a reference tracking mechanism to determine which objects can be freed, so by not modifying existing rows it simply wasn’t removing dependencies, indefinitely extending the lifetime of some objects. To fix this issue, the code that was overriding the existing encoded key with the random key was rewritten.
With the upsert issue fixed, it was time to start writing tests. As the changes affected fundamental DML commands, it was important that the operational semantics were preserved. There were two separate components to test: which query plans should bypass the scan, and which executed plans should run outside of transactions. The latter relied on the former, UPDATE/DELETE statements can only run outside of a transaction if the scan is bypassed, however there were cases where the scan could be bypassed and yet it was necessary to run inside of a transaction, such as when in an explicit transaction block. To test whether the query plan bypassed the scan, SQL regression tests were added which used EXPLAIN to inspect the query plan of various queries, and then executed the queries (along with subsequent SELECT *) to ensure they returned the correct result and modified the table properly. The output from the test was manually verified, and then saved as the expected output so any future runs of the test that deviated would be flagged. To test whether queries were run outside of transactions, an execution-time metric was added, allowing a Java test to be written which executed queries and then checked the metric value after each query to verify it properly executed either inside or outside of a transaction.
With testing complete, and the change reviewed, it was ready to land. After making the change, single-row UPDATE/DELETE statements were sped up by 2.5x, and also had the benefit of a reduced conflict window with other transactions that involve the affected row.
Aggregate pushdowns
In YSQL, aggregate queries (e.g. COUNT(*), MAX(col)) were not pushed down to the distributed storage layer. This meant that in order to perform an aggregate, all rows would need to be retrieved in the table and returned to the query layer where they would then be combined. In a distributed system this caused unnecessary overhead, sending rows across the network that would eventually just be merged into a single output row to the user. Due to a prefetch limit of 1024 rows used on YSQL scans, a table with four million rows spread across four tablets would require 3,908 (977 per tablet) RPCs to fetch all rows, as opposed to just four RPCs for a pushed down aggregate query (one RPC per tablet).
My initial design was to analyze the query during the construction phase and modify the plan to match the format of the result aggregate tuple, similar to my approach for single-row UPDATE/DELETE. However, Postgres only combined redundant aggregate expressions (e.g. SELECT MAX(col), MAX(col) + 1 → MAX(col)) in the execution phase. In order to minimize the work performed in the scan path, I chose to analyze and modify the aggregate execution after the common aggregates had been factored out in the execution initialization phase.
The first issue encountered in implementing the feature was matching the Postgres semantics in the DocDB expression evaluation code. DocDB already supported evaluating aggregate expressions for the Yugabyte Cloud Query Language (YCQL) API, however in this API the accumulator used in SUM was of the same type as the input column. This differed from Postgres which uses an int64 accumulator for int16 and int32 types, and a numeric accumulator for int64 types, to minimize the likelihood of overflows. The DocDB YSQL expression evaluation code was decoupled from YCQL where necessary to allow for the preservation of the distinct semantics.
The second issue encountered was that tablet scans were hitting a configured RPC timeout of 2.5 seconds. This issue was previously prevented by the 1024 prefetch limit on the number of rows fetched by a scan, however now that it was only returning a single aggregated row this prefetch limit would never be hit, and the entire tablet would be scanned in one shot. To fix this problem a scan time limit was introduced, avoiding hitting the RPC timeout on tablets with many rows. Even with the time limit, roughly 250,000 rows could be scanned per request, meaning only four RPCs would be required to scan a tablet with one million rows, compared to the 977 previously required.
On a local development cluster the change led to a 10% speedup for COUNT/MAX/MIN/SUM aggregates, and a 20% speedup for COUNT(*). Due to the 99% reduction in synchronous RPCs, gains will be much larger on a typical distributed cluster due to the higher latency between nodes. This change also opens up the possibility to parallelize scans across tablets, as each RPC request only returns a single row so there is less of a concern of overwhelming the YSQL client session.
Conclusion
I thoroughly enjoyed my time at Yugabyte this Summer, working alongside a supremely talented group of engineers. I was able to touch upon all aspects of the core database product, from the YSQL query layer and YB-Master coordinator all the way down to the distributed DocDB and per-node RocksDB storage engine. I got to work with open source codebases, developing on top of Postgres, RocksDB, and YugabyteDB itself, and most importantly gained the experience in distributed storage that I had been seeking.


