Log Aggregation in YugabyteDB with Grafana Loki
June 7, 2022
Log aggregation is an integral part of a distributed system. As the name suggests, a distributed system will have multiple processes across multiple machines, and each process will generate a lot of data. Looking at the data in silos is time-consuming and wouldn’t yield important information as the data sets still need to be correlated. But aggregating the logs is a huge productivity booster that helps to transform the raw log data into insightful information.
In a distributed system like YugabyteDB, where each process generates a ton of runtime log data points, it is precious to aggregate them in one place from an operations perspective. Specifically, aggregation helps turn the system-generated data into information that allows operations to manage the product better.
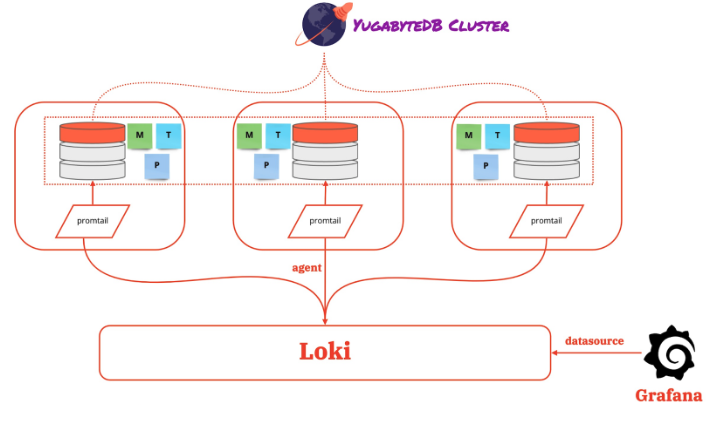
This blog will look at aggregating log data from multiple YugabyteDB processes using a trio of tools including Promtail, Loki, and Grafana.
Prerequisites
Before getting started, make sure to install the necessary tools on your machine:
Grafana Loki is a log aggregation tool and a data store optimized for efficiently storing and querying log data.
Promtail is a data collector agent tailored to Loki that runs on every distributed system node. Specifically, it discovers the log files on disks and forwards them with labels to Loki. But the trio of Promtail, Loki, and Grafana is the ELK equivalent that completes the full log aggregation stack.
Getting Started
We can get started with these tools in many ways. The standard method is to get the latest version of all tools and software from the official repositories, reserve multiple machines, and then install and configure them. But this is a lengthy, time-consuming process. Therefore, a better alternative is to experience it through Gitpod, a cloud-based service that allows you to run an integrated workflow quickly. Even better, there’s a YugabyteDB-Gitpod integration to make this process easier.
A code repository maintains Gitpod’s “development workspace as configuration” through a file named .gitpod.yaml. But YugabyteDB has a dedicated Gitpod base image pre-bundled with the database, allowing you to get started quickly.
YugabyteDB Cluster
Let’s create a three-node database cluster. First, we can mimic a distributed setup in a single Gitpod workspace.
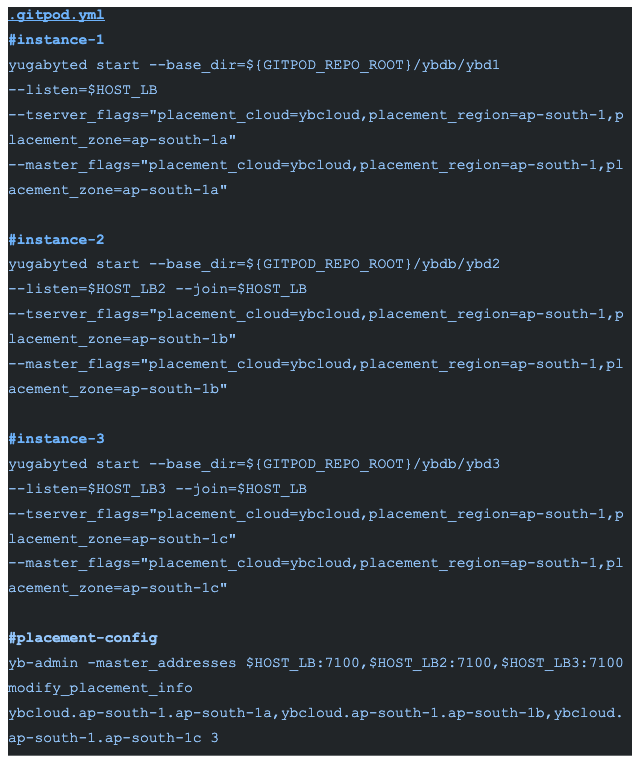
Starting a three-node cluster with a replication factor of 3 will bring up the appropriate three Master, Tserver, and Postgres processes. Each of the instances in ${GITPOD_REPO_ROOT}/ybdb/ybd{instance_id}/* generate the logs.
Now let’s also look at the logging trio for aggregating the log data for all three processes across all three running instances.
Promtail
YugabyteDB’s Master and Tserver processes emit the log data in “glog” format. Additionally, the Promtail agent running on every node can use regex to extract the necessary information from the log data.

This is similar to a Prometheus scrape config but for the log data. Next, repeat the config definition with appropriate changes for all three instances. This will push the log data to Loki. You can also find the install-info in the .gitpod.yml file.
Loki
Loki efficiently stores the log data from all the running instances of Master, Tserver, and Postgres for querying the data.
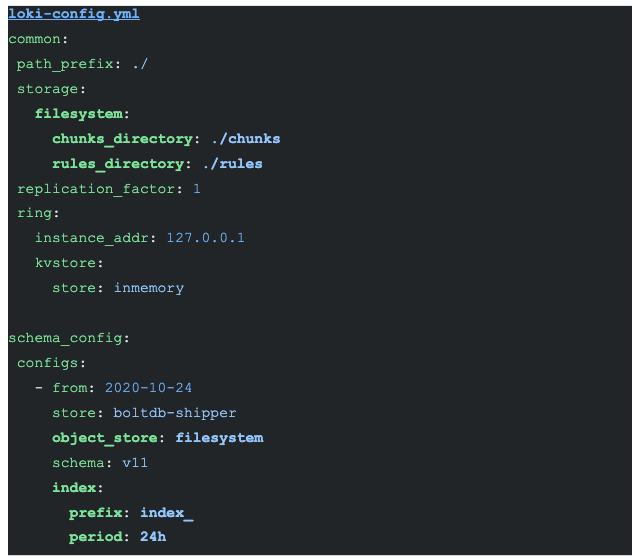
Labels from the log data are indexed, and the data compressed and stored on different data stores like S3, GCS, and a local file system. However, a local file system stores the information to keep it simple in this configuration.
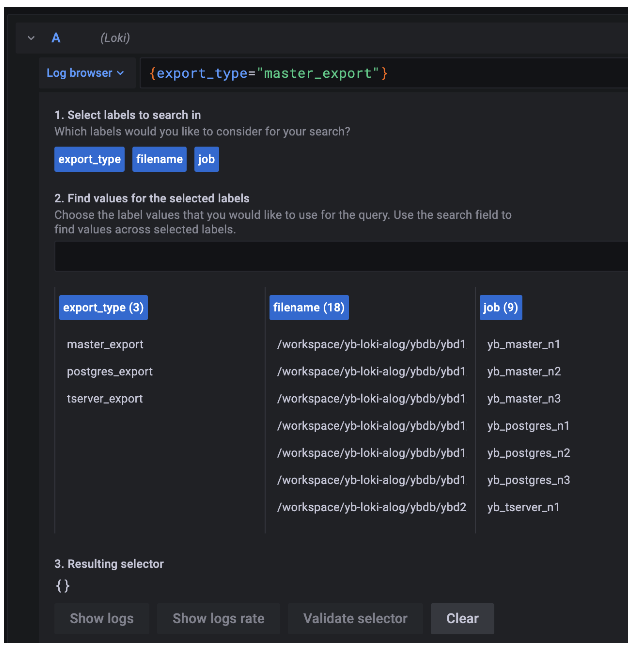
As defined in the promtail config, the labels are export_type(master_export, tserver_export, postgres_export), job (yb_master_{instance_id}, yb_tserver_{instance_id}, yb_postgres_{instance_id}) and the file names (from the storage path). But Loki indexes these labels and stores the actual data in the local file system.
Grafana
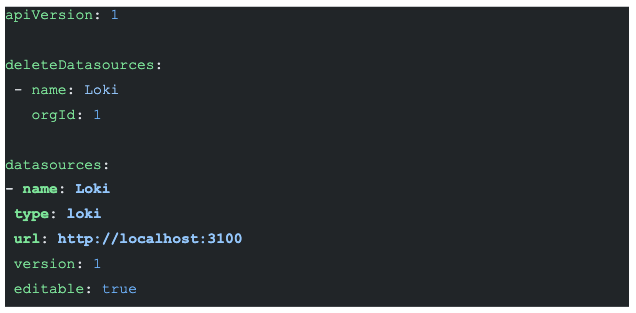
Grafana is a complete observability stack that allows you to monitor metrics, logs, and traces. Specifically, we use Grafana to explore the stored log data in Loki. Once we configure Loki as the data source, we can use the “Explore” option of Grafana to visualize the log data. We can then write “LogQL”(similar to PromQL) to query the log data and create visualization metrics.
Try log aggregation for yourself
The complete source code is available on GitHub. You also don’t need to make any of the infrastructure components. Additionally, all you need is to fork the source repo and launch the Gitpod terminal using the browser plugin.
Conclusion
In this blog, we aggregated the log data from multiple processes of YugabyteDB using a trio of Promtail, Loki, and Grafana. Please give this short tutorial a spin and let us know your feedback.
Have questions about YugabyteDB? Join our vibrant Community Slack channel to chat with over 5,500 developers, engineers, and architects.


