Change Data Capture (CDC) From YugabyteDB to Elasticsearch
May 18, 2022
This post walks through how to send data from YugabyteDB to Elasticsearch using YugabyteDB’s Change Data Capture (CDC) feature.
Background
YugabyteDB CDC is a pull-based approach to CDC introduced in YugabyteDB 2.13 that reports changes from the database’s write-ahead-log (WAL). More specifically, the detailed CDC architecture is mentioned in YugabyteDB’s documentation.
Elasticsearch is a search engine based on the Lucene library. It also provides a distributed, multi-tenant, full-text search engine with an HTTP web interface and schema-free JSON documents.
YugabyteDB CDC Elasticsearch architecture
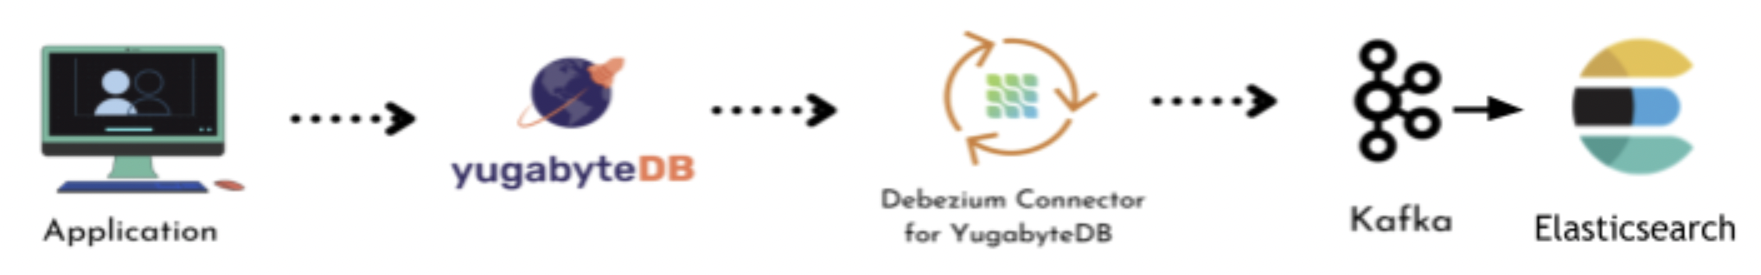
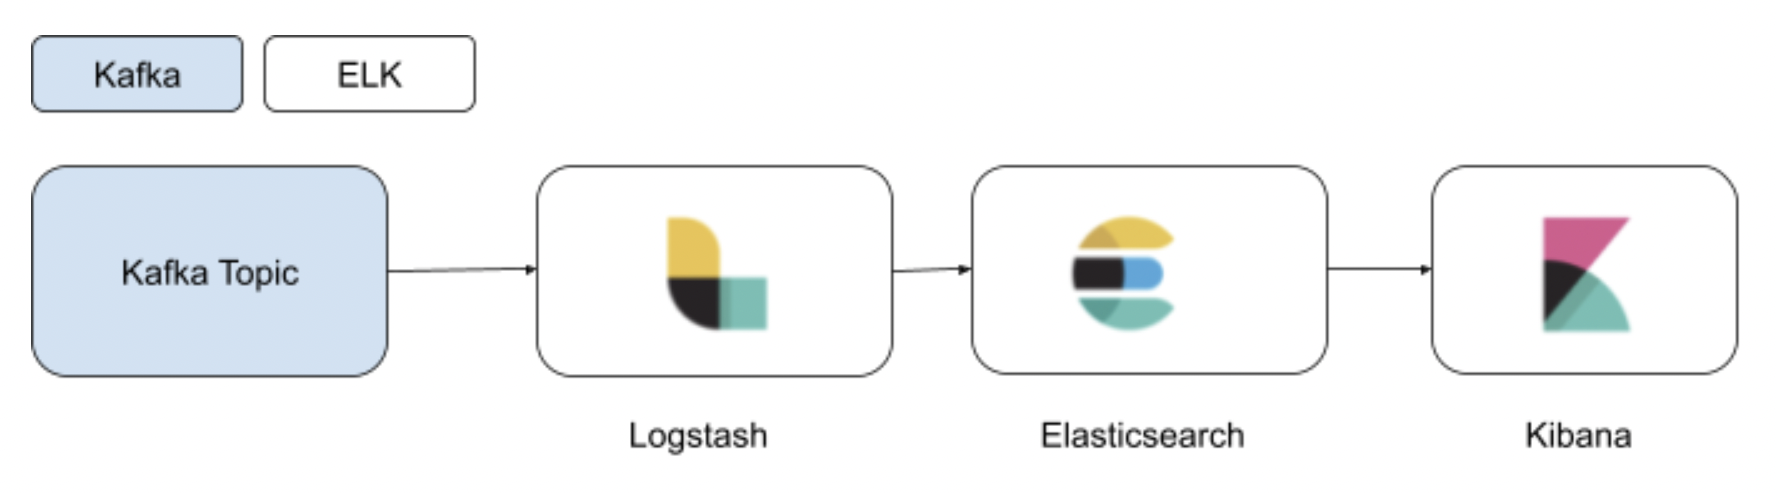
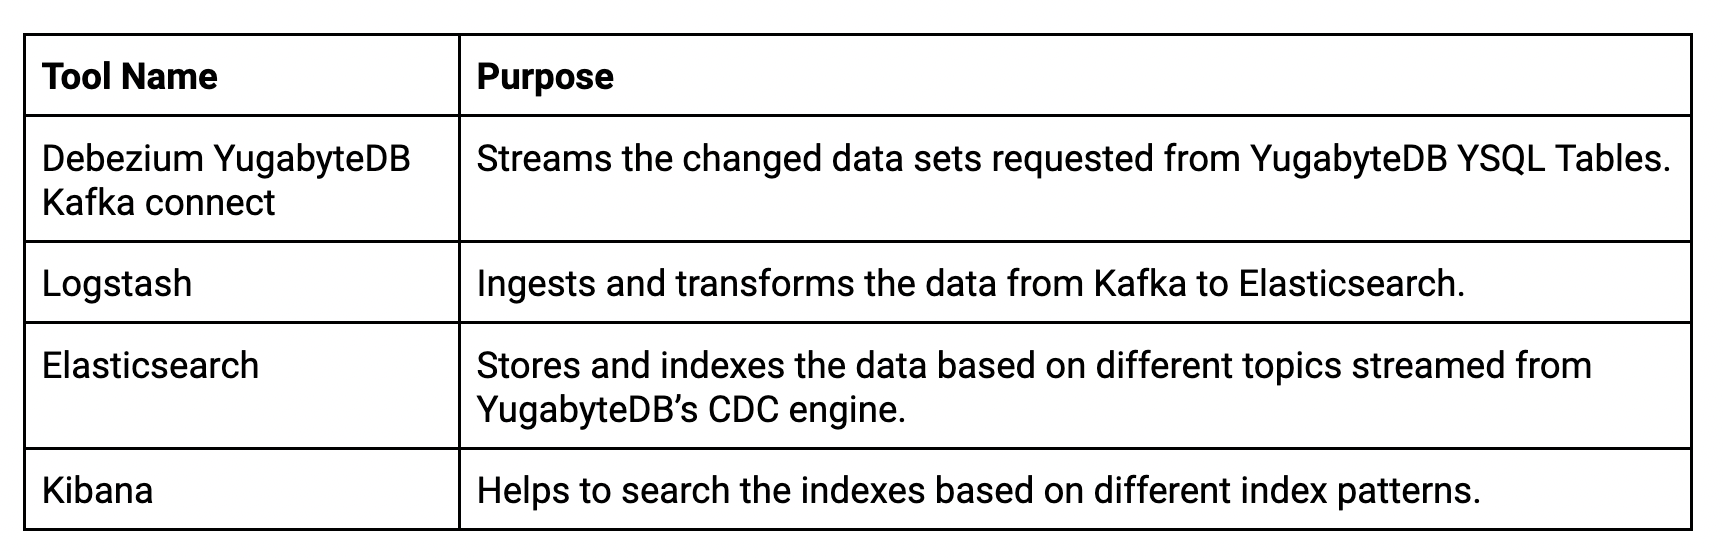
The streamed change data coming from the YugabyteDB CDC Debezium Kafka connector will be ingested through Logstash (Logstash-integration-kafka plugin) and stored as a JSON Message in Elasticsearch (through logstash-output-elasticsearch). Below you will find the detailed flow diagram.
YugabyteDB CDC Elasticsearch key use cases
YugabyteDB is an OLTP database that stores master and transactional data. More specifically, the data entered by the users needs a search or inquiry feature from the master data already stored in the YugabyteDB database. Additionally, Elasticsearch powers search for the data created or modified in YugabyteDB through CDC and continuously indexed in Elasticsearch. This enables applications to search the data based on different filtering criteria through Kibana or directly from Elasticsearch.
Use case #1: Build a near-real-time search engine for applications
Elasticsearch is a NoSQL database. This means it’s schema-less and stores data in an unstructured way despite the source (in this case, YugabyteDB) changing the table definition. It does so by adding or removing a column from the existing table that is already indexed.
Applications allow the users to search any data stored in Elasticsearch as part of YugabyteDB’s CDC-enabled table data. More specifically, the APIs supported by Elasticsearch help to search and filter based on the specific indexes. By default, Elasticsearch periodically refreshes indices every second, but only on indices that have received one search request or more in the last 30 seconds. Document changes are not visible to search immediately, but become visible within this timeframe.
Use case #2: Upstream for analytical or data science applications
Knowing the historical data requirements of data analytics use cases, Elasticsearch continuously helps to fetch the latest transactional data coming from YugabyteDB’s CDC connector. Additionally, Elasticsearch data can ship to any data lake, data warehouse, or data mart. From there, the data science application needs to train or learn the model continuously and help build predictive or prescriptive analytics.
Configuring a YugabyteDB CDC Elasticsearch sink
Step 1: You might already have an Elasticsearch server. If not, you can Install a stand-alone Elasticsearch server from binaries based on your operating system (e.g., Linux or MacOS) or Docker containers through this link.
Step 2: Post installation, ensure all three Elasticsearch services (i.e., Logstash, Kibana, and Elasticsearch) are running on your machine (either as services or Docker containers).
Here’s an example to check standalone service status:
sudo systemctl status elasticsearch.service
sudo systemctl status kibana
sudo systemctl status logstash
Step 3: Ensure YugabyteDB CDC is configured as your database. Additionally, make sure it runs per the above architecture diagram along with its dependent components. But you should see a Kafka topic name and group name. It will appear in the streaming logs via CLI or the Kafka UI (e.g., if you used KOwl).
Installing and configuring Logstash
Step 4: Install the Logstash plugin for Kafka and Elasticsearch using the below commands. Additionally, please keep in mind this step can be ignored if Logstash is already installed.
- Install Logstash Output for Elasticsearch using the below command:
/yourlogstashdirectory$sudo ./bin/logstash-plugin install logstash-output-elasticsearch
Post installation, the output should look like the image below:
- Install Logstash Input for Kafka using the below command. The latest Elasticsearch version contains the “logstash-integration-kafka” plugin. But you can verify if it needs to be installed with the below command:
/yourlogstashdirectory$.sudo ./bin/logstash-plugin install logstash-input-kafka
You’ll receive the below message if the plugin is already installed.

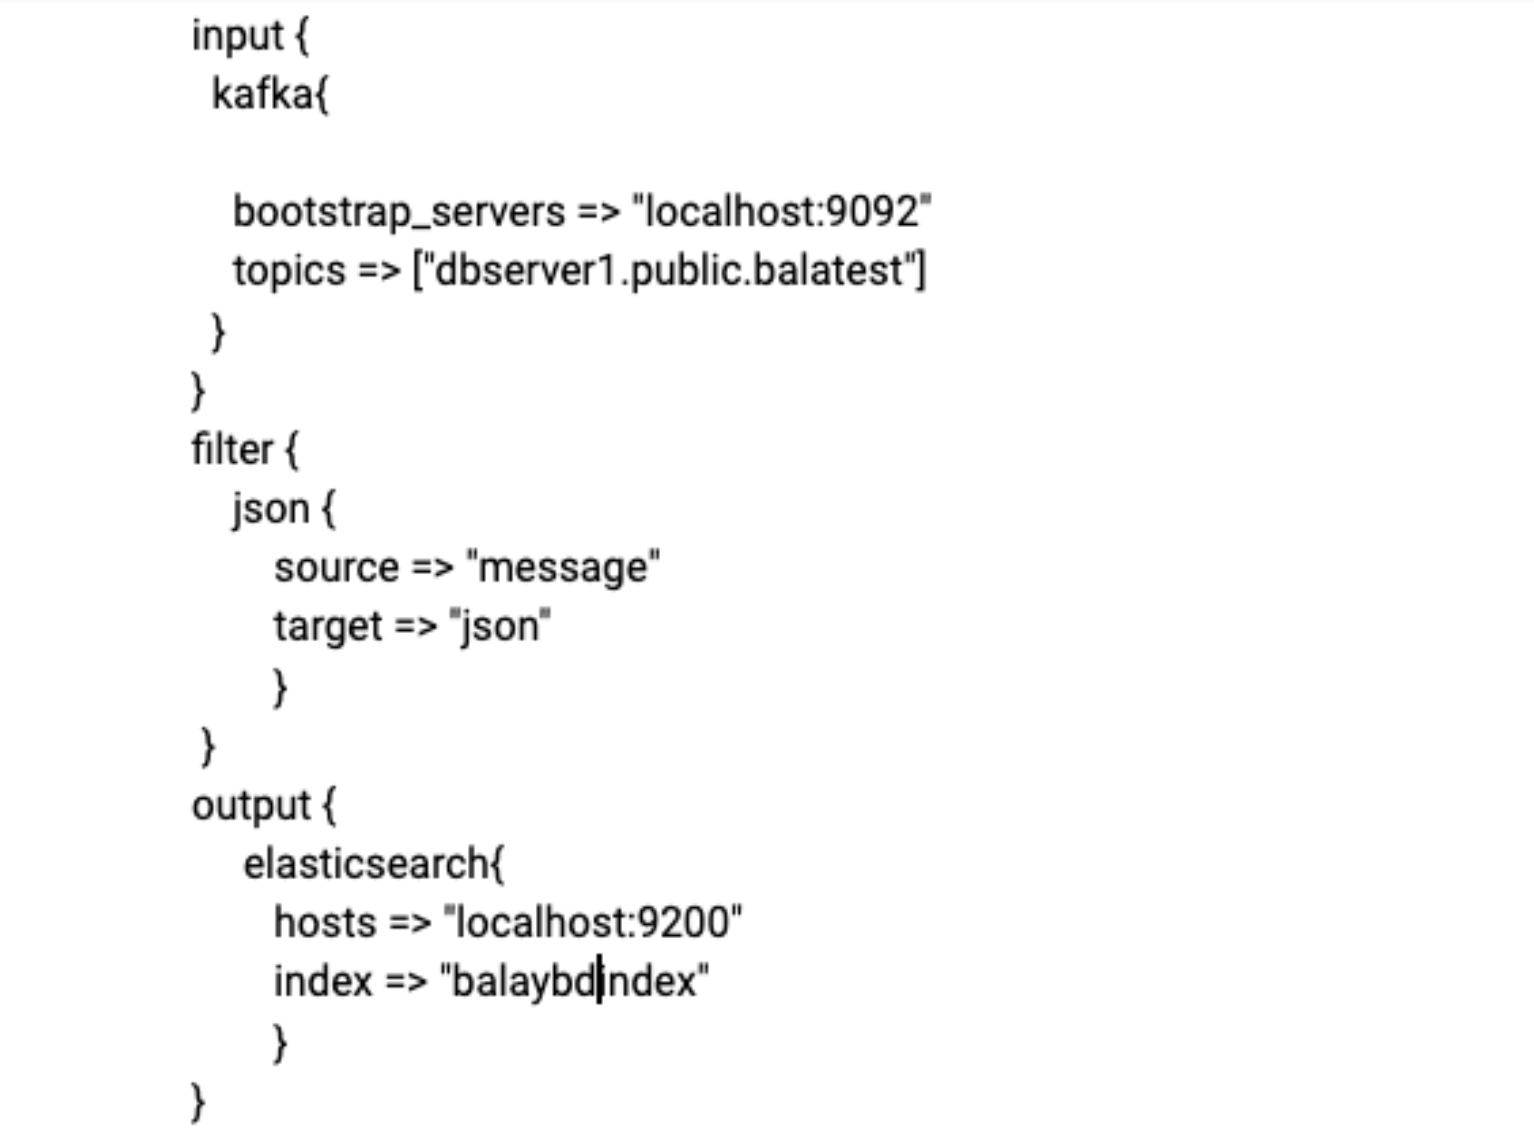
Step 5: Create a Logstash Configuration File (e.g., kafkatest.conf) with Input, filter, and output, as illustrated in the below diagram.
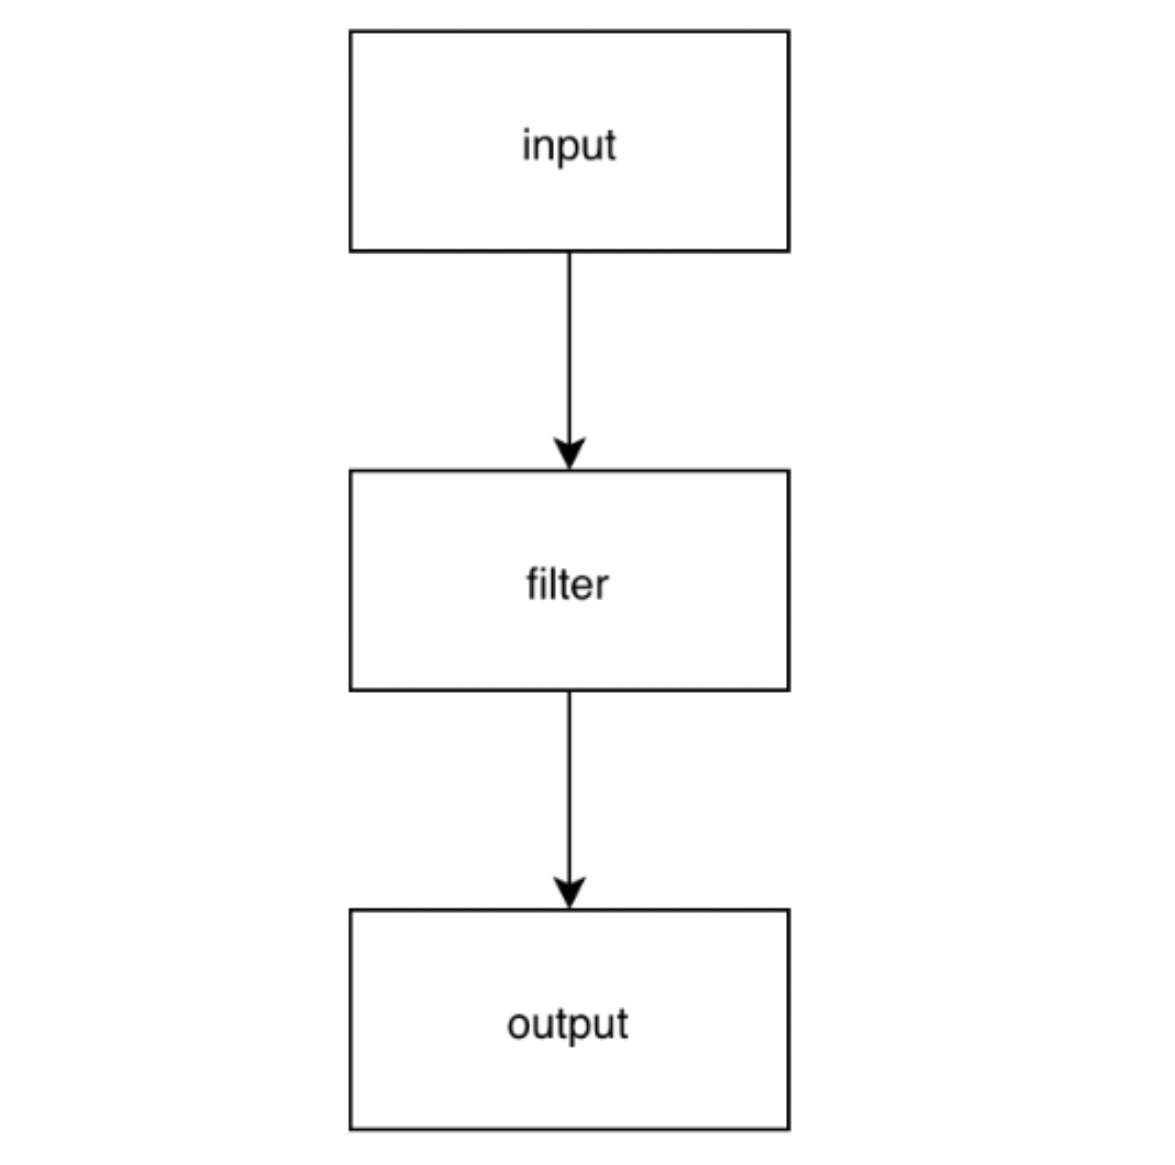
In this file, the Input is our YugabyteDB CDC Debezium Kafka connector. But Filter is optional and we can apply it if we need to remove any tags or fields coming from the CDC output. The output of Logstash is “Elasticsearch” with an Index name.
Note: We’re using localhost for both Debezium Kafka Connect and Elasticsearch Server. But based on your requirements, you can configure it as a different IP address or hostname.
Here’s an example of a Logstash configuration:
Step 6: Execute the Logstash configuration from the Logstash folder using the below command:

Confirming Index creation
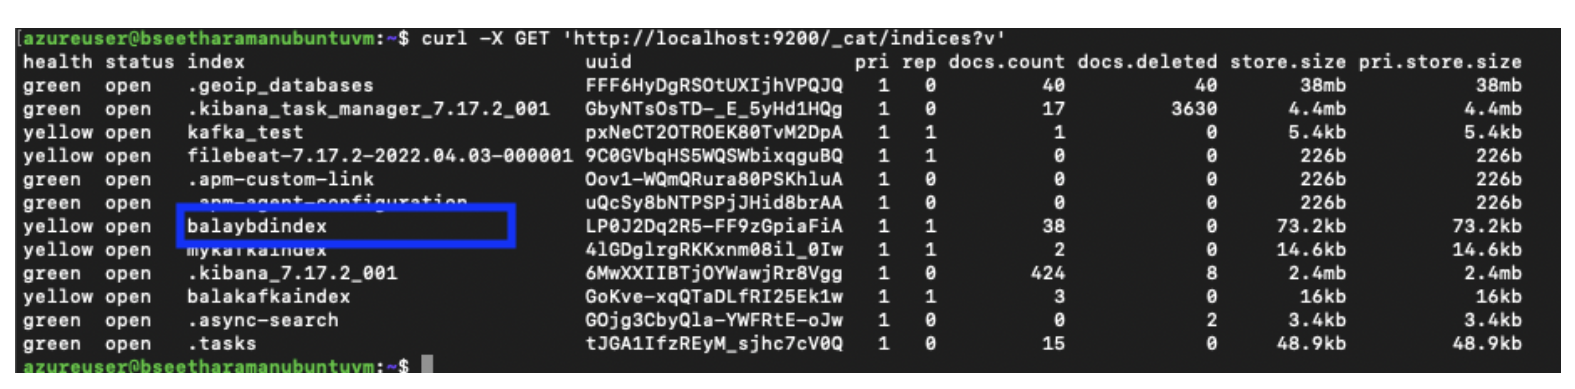
Step 7: Check to see if Index is created in the Elasticsearch server using the below command:
azureuser@bseetharamanubuntuvm:~$ curl -X GET 'https://localhost:9200/_cat/indices?v'
In the below image, you’ll see we used “balaybdbidex” to store the data streamed from Debezium Kafka Connect.
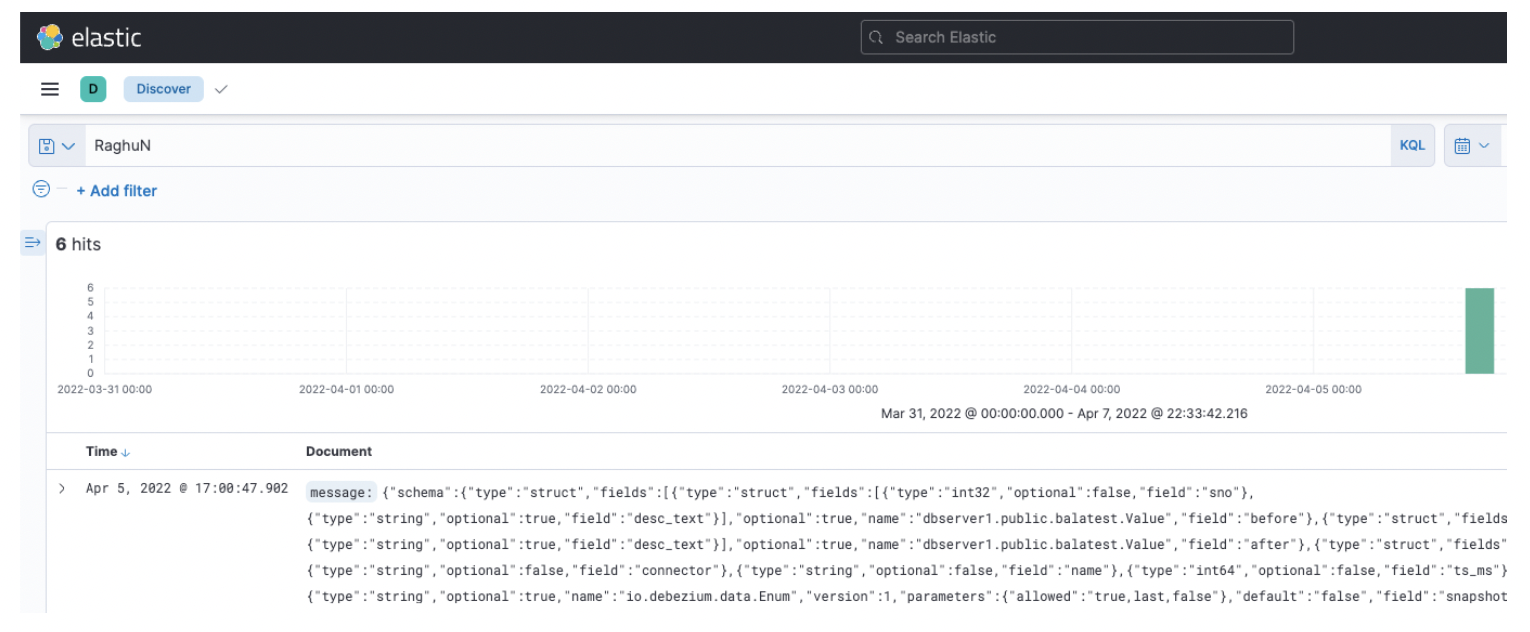
Step 8: Finally, search the data streamed from YugabyteDB CDC to Elasticsearch through Kibana’s Discover feature.
After clicking Kibana Dashboard’s URL (i.e., https://ip-address:5601), you’ll see the below screen:
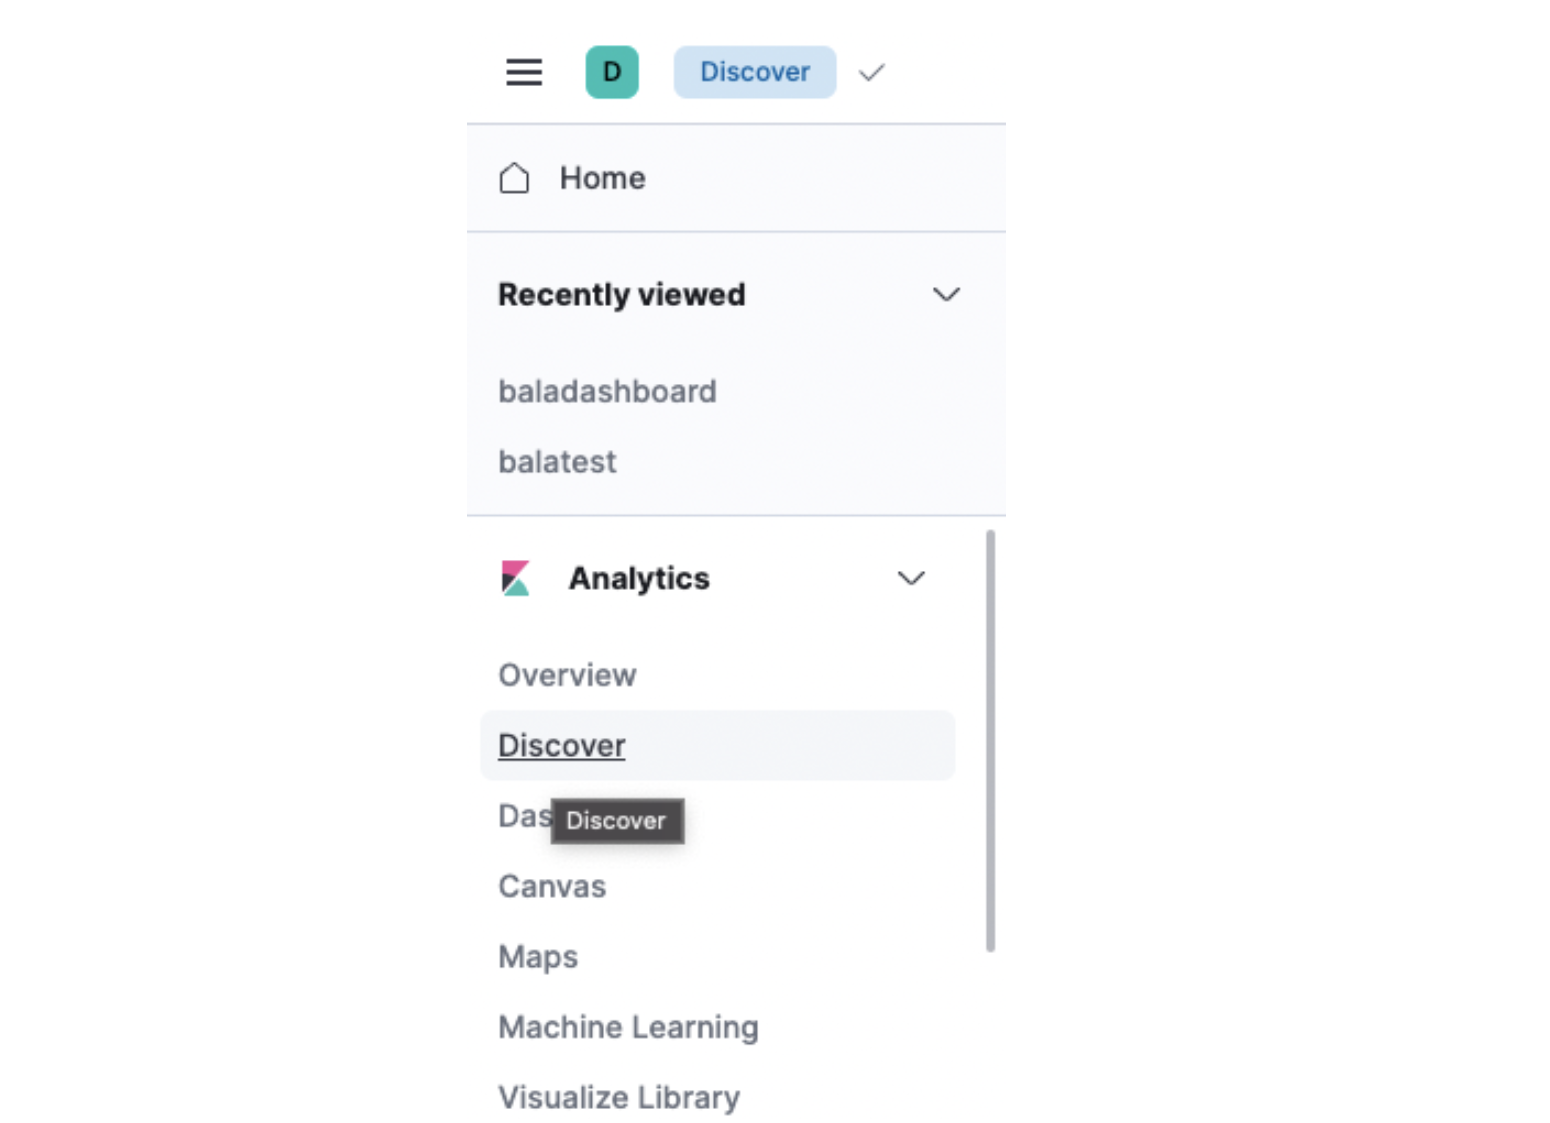
Next, navigate to the Discover link. It will take you to the Search page as shown below.
Conclusion
Using YugabyteDB’s CDC features, Elasticsearch can continuously access the latest records from Debezium Kafka Connect. It will also store them in a specific index or indices. Later, they can be loaded into any data lake for analytics use cases. The Debezium Kafka connector can also build a search application on top of Elasticsearch and will coexist with other apps that use YugabyteDB as the backend.
Join the YugabyteDB Community Slack channel for a deeper discussion on CDC with over 5,500 developers, engineers, and architects.


